Grow your business
Reports & analytics
Reports turn your service data into decisions — what's selling, when you're busy and how each day reconciled.
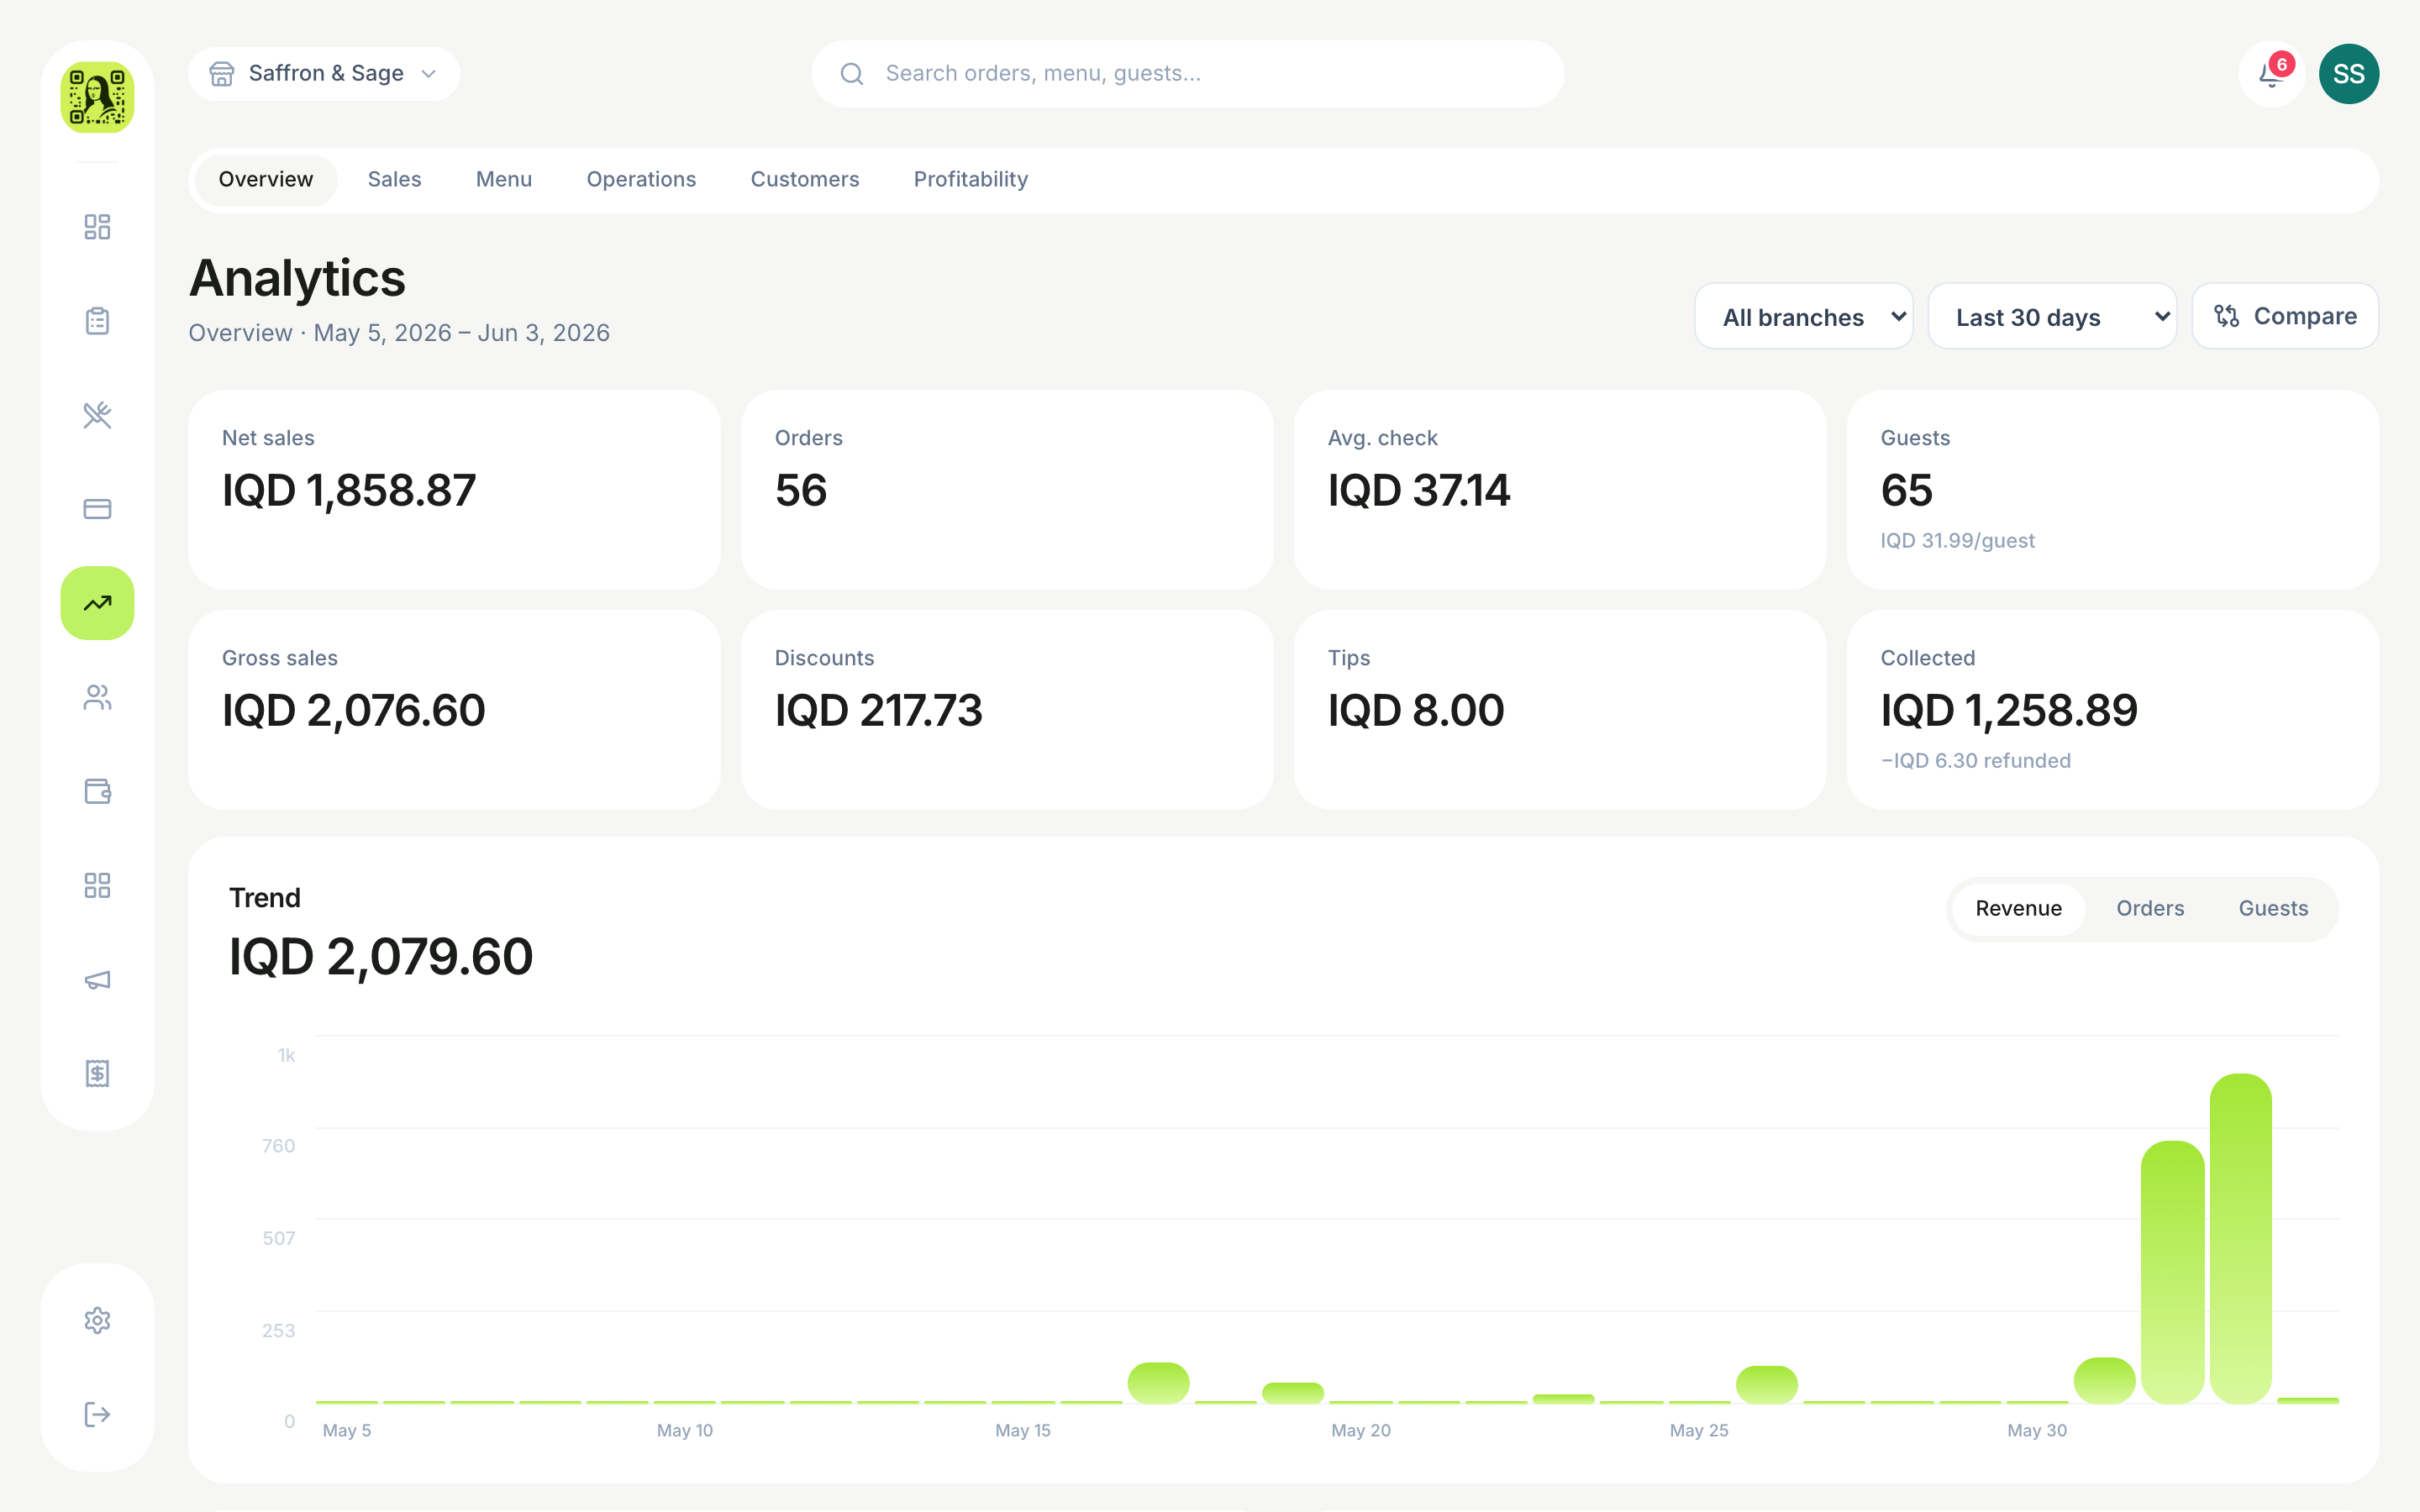
What you can see
- Sales totals with an interactive trend chart.
- Best-selling items and category performance.
- Daily cash-up by branch, including shift close-outs.
- A print-friendly layout for end-of-day reporting.
Where to find it
- 1Open Dashboard › Reports › Daily close.
- 2Pick a day and branch to see its breakdown.
- 3Use Print for a clean end-of-day copy.
Still need help with this?
Contact support